Client Newsletter Example: State of the Markets - Precious Metals Break Out - Macro Fundamental and Technical Look at the Major Indexes - Why We're Concerned Now
Published on July 8, 2020 @ 8:03am
No matter who you are (short-term trader or long-term buy and hold investor) I encourage everyone to read today's Investors Update, and even pass it along to anyone you care about who has a significant interest in the stock market. It's a macro fundamental and technical look at where these markets are right now, and why now's not a time for recklessness. Metals move higher yet again - GLD, SLV and GDX updated. Major Indexes next big move should be defined today. Another look at the hourly charts of the major indexes, a daily chart of the VIX Volatility Index, and what to look for.
Traders Update: Major Indexes Continue Their Volatile Ways - Today Should Be Definitive Yet Again - Metals Breakout
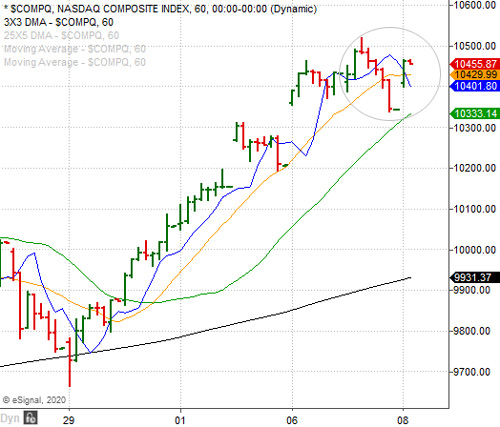
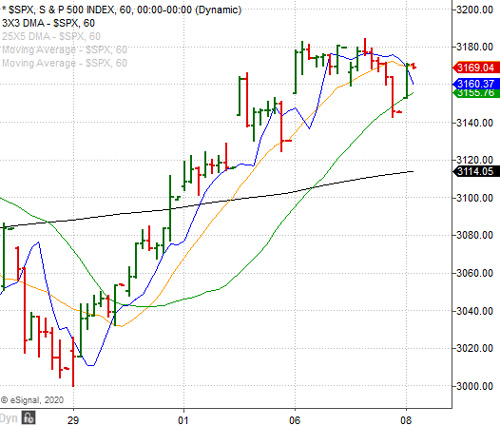
The major indexes continue to wrestle with certain key expansion levels and retracement levels on a short-term basis. Provided here are those same isolated hourly charts of both the NASDAQ Composite and S&P 500, and as you can see, neither of the two levels I mentioned yesterday have been breached on a daily close yet - specifically 10,485 on the NASDAQ and 3,177 on the S&P 500.
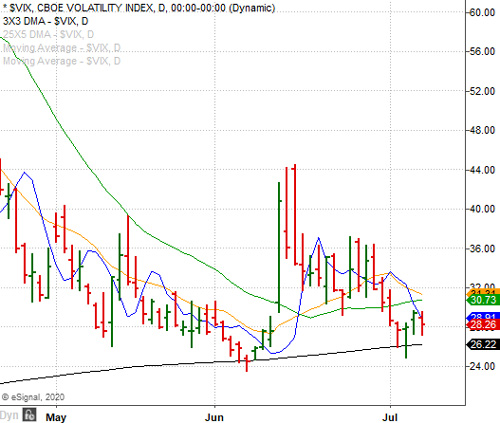
This also comes as the VIX Volatility Index had a few good days off its Monday low. You can see on this daily chart of the VIX below once it found its way back down around its 200-day SMA on Monday, it has since moved higher - once again suggesting professional traders are attempting to put a stake in the ground for another potential market-wide pullback.
Will the "PUT" Protection Team win this time around instead of the "PLUNGE" Protection Team? We should know today, because in the event the NASDAQ can close sharply above this week's high, all bets to the short side are off. If, however, neither the NASDAQ or the S&P can close sharply above their highs for the week, and more importantly resume yesterday's selling by day's end today, the context for another move lower is still in the cards.
It's pretty much that simple. However, let's pay close attention to the NASDAQ Composite today, because in the event the Index closes below 10,401 on any given hour today (without making a new high), the technical move would confirm another reversal signal - albeit on a very short-term basis. Therefore, we'll continue to remain patient suggesting any bullish leveraged ETFs around current levels. If the major indexes melt-up, so be it. We won't be a part of it unless we can get a big pullback first.
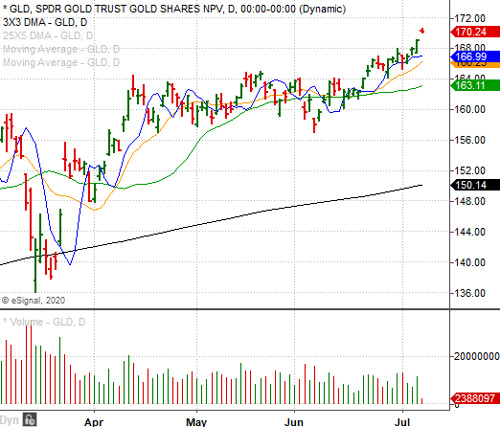
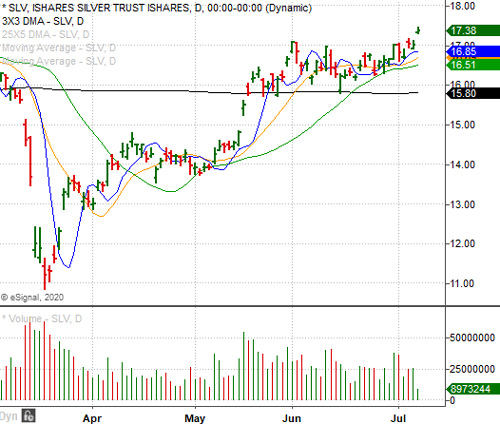
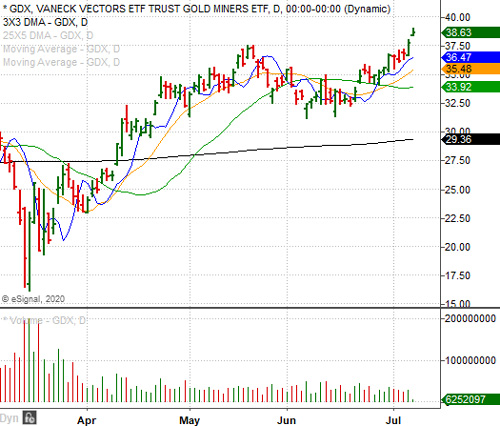
Last week, I strongly suggested traders and investors further increase exposure to metals. So far that move has proved prudent. Not only have silver and gold found new highs in recent days, so have the miners. Provided here are daily charts of GLD, SLV and GDX, the three primary ETFs tracking the above. As you can see, GLD has made another new multi-year high today - one not seen since 2013, while both SLV and GDX both continue to look technically attractive.
Just like all of the major indexes though, we're going to continue to see volatility in metals in both directions, but when I look at the long-term fundamental and technical landscape for metals, it all continues to point to higher levels ahead. I really can't say the same for the major indexes for all that much longer though, so please read the Investors Update section below as to why.
Investors Update: A Macro Fundamental and Technical Look at the S&P 500 and NASDAQ Composite - Things Continue to Get Longer in the Tooth
While our Traders Update always provides a very short-term look at what we're expecting and why, long-term buy and hold investors are typically more interested in what the long-term technical and fundamental landscape is telling us and why. There's no question fundamentals always win in the end, which is why what I'm seeing from both a fundamental and technical perspective right now continues to remain a concern.
First, based on where the NASDAQ Composite and S&P 500 are trading these days, current valuation levels and forward growth metrics are becoming a fundamental concern. And, based on certain key expansion levels we like to use for every chart timeframe in question, the NASDAQ Composite is fast approaching a decade long expansion level that may well end up becoming a concern when it's all said and done.
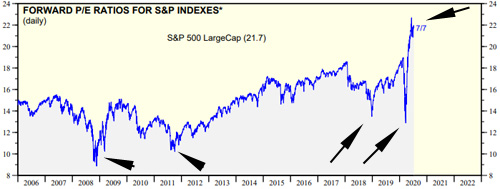
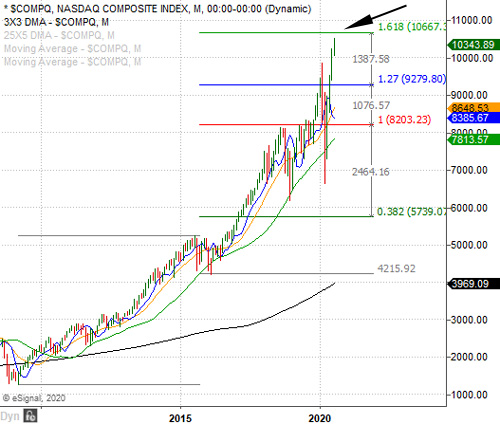
With that, provided here are two very important charts, one of the historical forward price to earnings ratio of the S&P 500 Indexes dating back to 2006, and a monthly chart of the NASDAQ Composite - with its most important expansion levels dating back to the bottom of 2009.
As of yesterday, the forward P/E for the S&P 500 Indexes is currently at 21.7 - a level not seen since the Internet Bubble. To be fair though, we can swallow high forward P/E levels in an individual stock, or even the major indexes, as long as the growth is actually going to be there. Meaning, savvy investors are always willing to pay in advance for growth as long as the growth is going to be there. The problem many times is Wall Street will tell you the growth will be there when in fact it never ends up coming when they say it will - if ever.
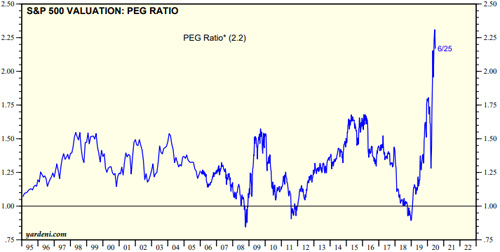
Further, the current price to earnings growth ratio (PEG) for the S&P 500 is right around 2.2 right now. For those who might not know, the PEG for a stock or an index is one of the better valuation metrics for whether or not the price you're paying for a stock now is worth its potential forward growth. And, although a PEG of 2.2 isn't bad it's not all that attractive either. We'd prefer to see a PEG somewhere less than 2, and preferably less than 1, as it's always been my preference to use 1 as the benchmark PEG for just about anything.
In short, from purely a fundamental perspective these markets remain very expensive unless the next few years of economic growth and earnings expansion for corporate America serve up growth not seen in decades. To be fair, I suppose anything is possible. It's important to point out that back in the Internet Bubble of 1999 - 2000 the S&P 500's forward P/E did achieve roughly the 25 level before things finally imploded, and who's to say they can't go beyond that forward P/E of 25 before these markets implode again?
However, when we take a big step back and look at how the decade long leading NASDAQ Composite continues to behave from a technical perspective, you can see here the final expansion level from its 2009 low sits at roughly the 10,600 level - just a few hundred points from where it's at now. That's clearly a concern because we all know what happened the last few times certain key expansion levels were achieved on the Composite over the last few years. Basically, the major indexes imploded before finding key bottoms both times.
The bottom line is now you know why I continue to opt for fair to undervalued ideas that look to offer reasonably to very attractive forward growth, and why we continue to suggest taking the profits when they're there. We can chase those high flying growth stocks all day long, but that type of strategy typically doesn't end well for the long-term buy and hold investor.
This is why we're always looking for ideas we believe every trader/investor of all strategy types and timeframes can benefit from, rather than suggesting those stocks that have clearly gone well beyond what I think they're worth. No matter what Wall Street tends to lead one to think, I'm always going to be cognizant of the buy and hold investor's future when it comes to buying something and holding it for the next several years.
Current Stance for Equities:
Create a Free Trial Here To See Our Current Stance for Equities: https://www.vikingcrest.com/register
Suggested Long-Term ETF Holdings:
Create a Free Trial Here To See Which ETFs We Continue to Suggest Investors Maintain Exposure To: https://www.vikingcrest.com/register
Individual Company Ideas:
Create a Free Trial Here To See Which Stocks We've Recently Suggested: https://www.vikingcrest.com/register
Important Strategy Tips On Trading, Investing, Portfolio Management and Using Our Service
Very important for any trader and investor who wants to be successful. To review a list of rules and disciplines to consider go here: https://www.vikingcrest.com/article/88. It's a good idea to review this article from time-to-time for any newly added rules.
To view our current trading ideas log-in here: https://www.vikingcrest.com/member. If you have any questions regarding a specific stock - even if it's something we haven't suggested - you can reply directly to this email, or call us at 619-369-9316.
John Monroe - Senior Editor and Analyst