Client Newsletter Example: Making Sense of the Macro Market Landscape - Everyone's Perception is Their Own Reality
Published on June 9, 2021 @ 8:24am
If you're trying to make sense of what's happening across the entire equity landscape, today's newsletter is worth the read, as perception is reality. Small caps continue to lead on a short-term basis - with the Russell 2000 working to test its all-time high. The NASDAQ 100 tracking QQQ gets volatility at that last point of resistance, while the S&P 500 failed to make a new all-time high yesterday, and the DOW continues to lag. Here's the details on all of it...
Making Sense of the Macro Market Landscape - Everyone's Perception is Their Own Reality
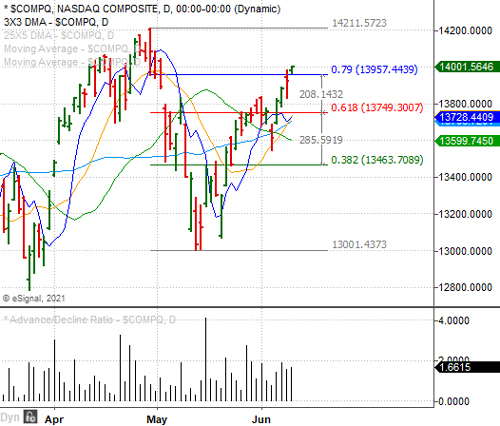
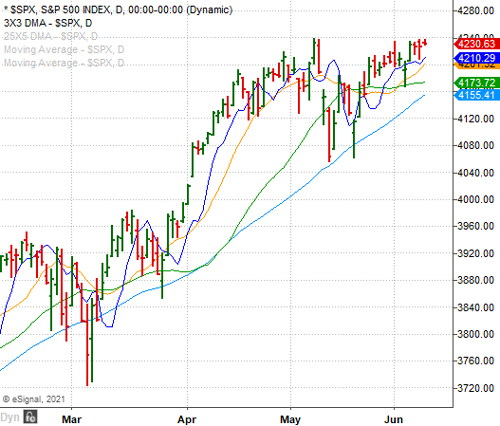
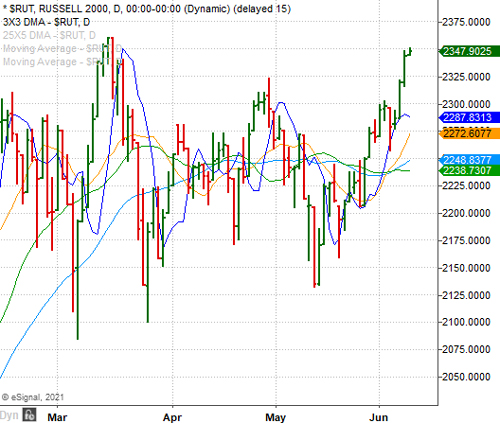
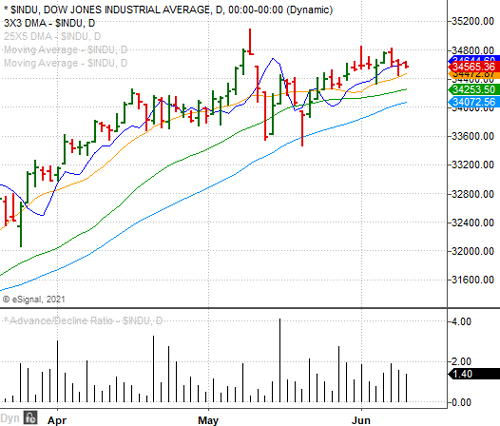
On an extremely short-term basis, all of the Major Indexes yesterday continued to suggest a slight bullish undertone - one that may well lead to another move higher for equities across the board. The Russell 2000 Small Cap Index is on the verge of testing its all-time high after the S&P 500 failed to make a new all-time high yesterday. The DOW has once again resumed its lagging behavior for now, while the NASDAQ Composite found itself struggling to break above its last key resistance level just yesterday.
Volatility ahead? Maybe, but ex the NASDAQ 100 tracking QQQ, all of the other Index tracking ETFs in SPY, IWM and DIA have breached their most important resistance levels on a short-term basis. Meaning, all it's going to take is one big day to the upside across the board, and these markets should make more new all-time highs again.
Provided below are daily charts of the NASDAQ Composite, S&P 500, Russell 2000 and DOW. As you can see, the NASDAQ yesterday struggled around that .79 retracement level I referenced in yesterday's newsletter, while the S&P 500 failed to make a new all-time high after testing it early yesterday morning. Instead, both moved lower in early morning trading, only to come back a bit on the day.
The Russell 2000 Small Cap Index continues to play a game of catch-up to that of the S&P 500, and now appears to be on the verge of testing its all-time high as well. As for the DOW, all it would take is one big day to the upside for it to do the same. So, as you can see these markets are on the verge yet again of defining their next big move.
The bottom line is for those who continue to lack trust in these markets, now would be the time to enter a short on the NASDAQ Composite or the NASDAQ 100 tracking QQQ. However, you will need to use yesterday's high on both as a backstop. In other words, should the NASDAQ Composite and QQQ even slightly breach yesterday's high, you'll have to cover that short, and even get long if you want to take advantage of more potential upside.
From far more of a long-term macro perspective, I continue to have healthy debates with various industry professionals regarding how high these markets can actually go, and when this bull market could potentially come to an end again. Everything from what stage in the Elliott Wave counts these markets are to long-term relative strength, economic data, valuations and so much more. However, if one is going to be right, he/she needs to know history, as well as what these markets have and likely will continue to fixate on in the months/years ahead.
First, it's never about a bull market coming to an end forever, because history has clearly shown that no matter what has happened in the world, the stock market is going to end up going higher when it's all said and done. Therefore, it's only ever about pegging key long-term tops and bottoms all along the way, which we've been as good or better at over the years as anyone else I know.
Further, despite the fact these markets will always find a way to make more new all-time highs, there can be a lot of damage done to one's portfolio if the investor or professional in question ends up getting way too aggressive around key pivotal long-term tops. Therefore, the single most important thing long-term investors should know is the technical landscape of the broader markets' weekly and monthly charts.
Before I get into that update here today though, I want to make a comment regarding psychology, and the single most important thing when it comes to anything in these markets - perception is reality. I say that because these markets will never care about how you and I "feel" on any given day, and they're never going to care about how much you and I make or don't make. They're going to do what they do, and all we can do is take as much advantage of it all along the way, while managing risk.
I know investors and industry professionals who can't believe what these markets have done over the last decade, and I know investors and professionals who have done nothing but taken advantage of it - hence everyone's perception is their own reality. However, if one is willing to use protective stops in anything and everything their buying or shorting, then they're most certainly going to reduce the risk.
Further, outside of any major geopolitical event like war etc., all these markets ever seem to care about is interest rates, technicals and momentum, earnings/valuations and economic data - in that order. If one knows that, and he/she can be extremely pragmatic about all of it, with no regard to political opinions, then these markets can actually provide a lot more clarity for someone.
Still, investors remember Black Fridays, Black Mondays, the Dot Com collapse in 2000, 9/11, the mortgage crisis that led to the Great Recession, and everything in between. Yet, these markets still made new all-time highs when it was all said done. Therefore, it's all about knowing when a bigger correction is coming vs. a minor correction or much needed pull back.
Right now, we continue to remain in a very attractive interest rate environment for equities, and that's not likely to change for at least a few years. Momentum is clearly on the side of the bull into the foreseeable future, while valuations are clearly higher than anything we've seen since 1999.
However, when it comes to the latter we have a Fed that clearly wants to see inflation rise for a while, which should be good for assets across the board despite what I believe to be questionable valuation metrics. Then, when you consider what's likely to happen from a momentum perspective, and you consider the pent up economic demand we should continue to see for a while, I just don't think these markets are close to a long-term top. Sure, short to mid-term top maybe, but not the kind of top that ends up crushing portfolios.
Why? Provided here is a weekly and monthly chart of the S&P 500 - the benchmark Index for everything equities over the last several decades. The bottom line is this is not what long-term tops look like. As a matter of strong opinion, it won't be until these markets start moving like a runaway freight train to the upside for several weeks (even months) that we'd start to get concerned, because key tops are usually preceded by long runaway bars on the monthly chart in question before the inevitable top is in.
However, I will point to the fact the S&P 500 is likely at some point this year to come back to its 3X3 DMA (dark blue curved line) on the monthly chart here, which currently sits just above the 3,800 level. If that were to start developing soon, it would equate to roughly a 10% correction, but depending on why it got there could merely end up being another tremendous buying opportunity.
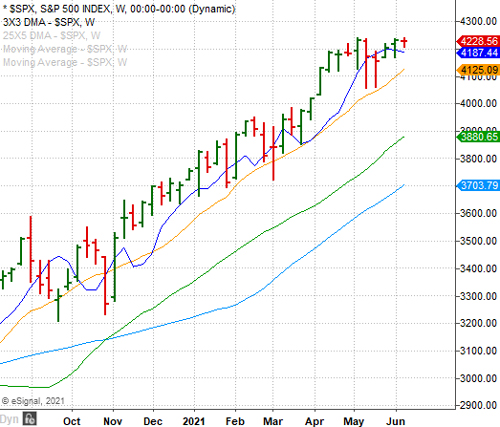
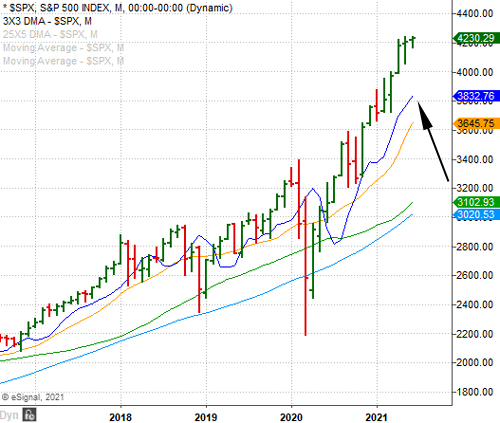
At this point, everything from relative strength to price action of all of the Major Indexes does not spell a looming long-term top to me. Sure, these markets are going to have corrections and pullbacks, but until we get that last big melt-up move I just don't see these markets collapsing. Of course there's always the possibility of a major geopolitical shoe dropping, but that's what protective stops are for. In other words, deciding in advance if something breaches a certain level that you're going to pull the plug on the stock/ETF in question.
To close out today's edition, I want to circle back to that comment above regarding "perception is reality". It's important to believe in the future, but it's also very important not to be reckless and careless. As long as you're focusing on the risk management side of the equation, it's perfectly OK to trust these markets on a long-term basis, and more importantly be willing to step in when there's blood in the street again.
Until then, we'll simply continue to focus on companies and ETFs we find attractive for the time being without too much regard as to what will happen at some point way down the road. Again, we're going to get minor corrections and pullbacks all along the way, because that's what stocks do, but in the end I'm still fully convinced these markets will end up going higher - much higher.
Current Stance for Equities:
Create a Free Trial Here To See Our Current Stance for Equities: https://www.vikingcrest.com/register
Suggested Long-Term ETF Holdings:
Create a Free Trial Here To See Which ETFs We Continue to Suggest Investors Maintain Exposure To: https://www.vikingcrest.com/register
Individual Company Ideas:
Create a Free Trial Here To See Which Stocks We've Recently Suggested: https://www.vikingcrest.com/register
Important Strategy Tips On Trading, Investing, Portfolio Management and Using Our Service
Very important for any trader and investor who wants to be successful. To review a list of rules and disciplines to consider go here: https://www.vikingcrest.com/article/88. It's a good idea to review this article from time-to-time for any newly added rules.
To view our current trading ideas log-in here: https://www.vikingcrest.com/member. If you have any questions regarding a specific stock - even if it's something we haven't suggested - you can reply directly to this email, or call us at 619-369-9316.
John Monroe - Senior Editor and Analyst
