Client Newsletter Example: Indexes Back Off On Key Resistance - Important Info On Rates and the State of the Equity Markets
Published on October 19, 2022 @ 6:49am
Please read today's newsletter to the end - very important info regarding interest rates. As expected, all of the major indexes backed off yesterday after achieving key short-term resistance levels. Here's what to look for now, along with an op-ed on when markets actually end up bottoming for good.
Indexes Back Off On Key Resistance - Important Info On Rates and the State of the Equity Markets
Stocks always go much higher than anyone would have thought, much lower than anyone would have thought, and right now it's the latter. It was inevitable that the twelve year long bull market was going to come to an end, but the good news is this ongoing bear market is going to come to an end as well. It's just about continuing to try and figure out where the markets' ultimate bottom is going to be.
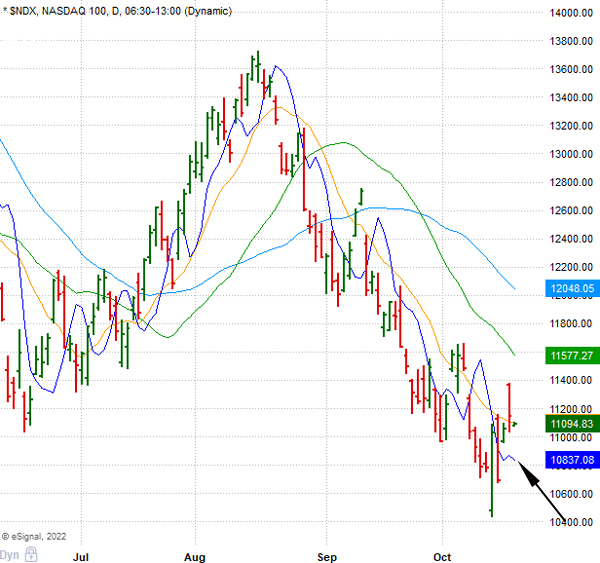
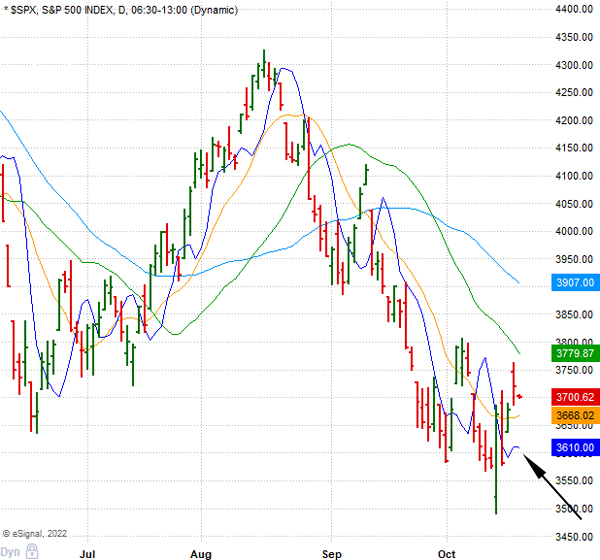
With that, all of the major indexes yesterday reversed lower right on cue. After a pretty nice run-up into Monday's close, both the NASDAQ 100 and S&P 500 ran up into some potentially key short-term resistance levels, and reversed lower again. Provided here are daily charts of both showing you what I'm referring to.
Now, both can still close below those 3X3 DMAs (dark blue curved lines) you see here, but if they're going to start moving significantly higher, they will need to close back above those same DMAs in the days that follow - all without testing their recent lows. Why? If they do end up testing their recent lows, the probability for even lower levels increases dramatically. Meaning, if both do end up testing their recent lows, I'm fairly convinced the test will fail, which would end up resulting in another sharp move lower across the board.


This is why we continue to suggest not chasing anything higher these days, because no matter what stock you're thinking of buying, if you give it enough time you're probably going to end up with a better entry price. At the very least, you can wait for confirmation of a stronger reversal signal, which is what we're looking for now on the NASDAQ 100 and S&P 500.
Nevertheless, there are still going to be tremendous short-term trading opportunities (in both directions) that are going to continue to surface. It's just going to require us being selective, we're going to have to trade contrarian extremes, have some patience, and more importantly good trade management - not to mention keeping a very close eye on interest rates and the dollar.
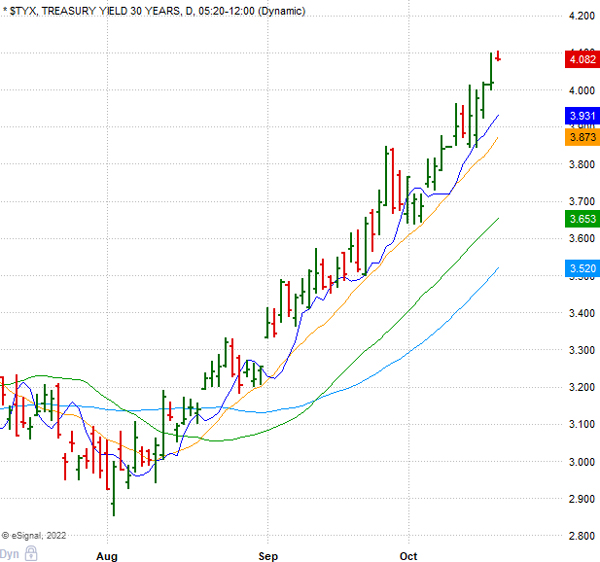
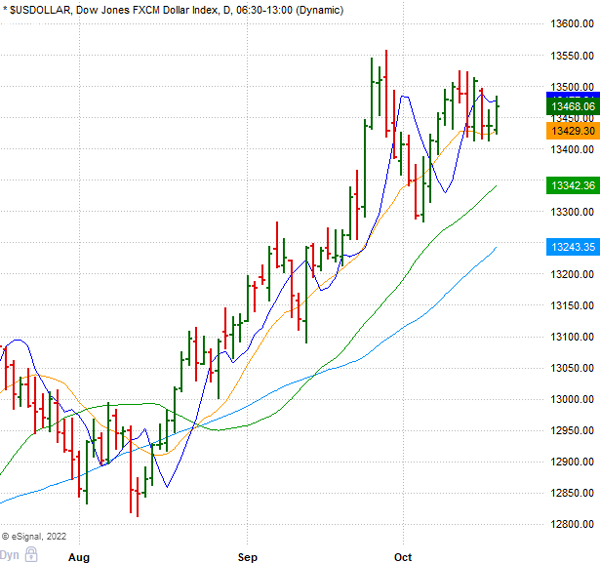
Provided here are daily charts of both the 30-Year Treasury Yield and the dollar, and as you can see neither has yet to show any significant signs of weakening lately. Sure, the dollar has started to struggle a bit to make new highs, but even that remains suspect right now, because the longer the dollar continues to exercise its sideways trading activity lately, the more and more it will suggest more new all-time highs.


The bottom line is with the current Federal Funds Effective Rate (FFER) still in the 3% to 3.25% range, long-term investors shouldn't be getting too excited about the possibility of these markets putting in the type of bottom that can last for several years. Not yet anyway. As a matter of opinion, it's likely not going to be until the FFER gets much closer to the Fed's target of roughly 4.6%.

Remember, your treasury yields are not the FFER. In other words, with the 30-Year Yield around 4.2% right now, it's probably still going much higher because the FFER is only in the 3% to 3.25% range. However, at the point the FFER does start getting close to that 4.6% range and/or CPI Data starts to come way down, that could very well end up being among the bigger clues that the worst may well be over.
Again though, these markets will front-run the idea of rates and inflation topping out well before that actually happens, and the above definitely doesn't mean we won't get some significant bear market rallies that we can take advantage of all along the way. Just be careful of buying and holding anything new for too long in this environment right now, because I'll say it for the umpteenth time - all these markets care about is interest rates, not economic data. At almost every point in history, when rates top out, markets bottom.
Swing Trade Set-Ups w/ Suggested Trade Parameters
Create a Free Trial Here To See Our Current Stance for Equities: https://www.vikingcrest.com/register
Attractive Long Term Sector/Index ETFs and Individual Companies
Create a Free Trial Here To See Which ETFs We Continue to Suggest Investors Maintain Exposure To: https://www.vikingcrest.com/register
Important Strategy Tips On Trading, Investing, Portfolio Management and Using Our Service
Very important for any trader and investor who wants to be successful. To review a list of rules and disciplines to consider go here: https://www.vikingcrest.com/article/88. It's a good idea to review this article from time-to-time for any newly added rules.
To view our current trading ideas log-in here: https://www.vikingcrest.com/member. If you have any questions regarding a specific stock - even if it's something we haven't suggested - you can reply directly to this email, or call us at 619-369-9316.
John Monroe - Senior Editor and Analyst
