Client Newsletter Example: First Quarter GDP Better Than Expected - Major Indexes Continue to Hunt for Something More Definitive
Published on June 29, 2023 @ 6:42am
First-quarter GDP comes in higher than expected. The GDP Price Index comes in slightly lower than expected. Here are the details on both. Basically, more hurry up and wait for traders and investors looking to capture the markets' next big move. Everything continues to behave accordingly - volatility in both directions, but no new multi-month highs yet. However, we could see something definitive as soon as today or as late as Monday of next week (markets are open Monday but closed Tuesday).
First Quarter GDP Better Than Expected - Major Indexes Continue to Hunt for Something More Definitive
With plenty of attractive long-term ideas just sitting in the wings, it's clearly far more about whether or not these markets are going to continue higher or if they're on the verge of moving sharply lower again. And this morning, one would think that the Fed is going to have to get a lot more diligent with interest rates if the FOMC is going to avoid more inflation pressure.
First-quarter GDP came in at 2%. Analysts were expecting 1.3%. That's quite a bit of disparity. The GDP Price Index, which measures export prices here in the United States, came in at 4.1%, which was just slightly lower than the 4.2% economists were expecting. All in all, it wasn't really enough of a reason for these markets to move much, but if the Fed is going to curb future inflation, they're likely going to raise interest rates again next month.
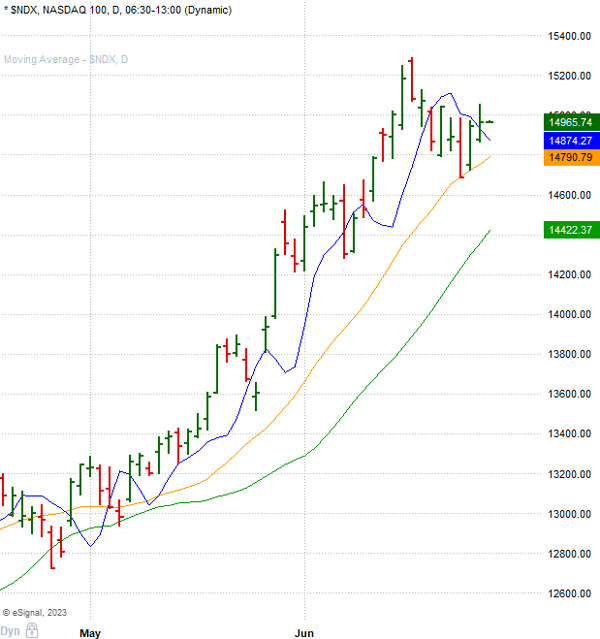
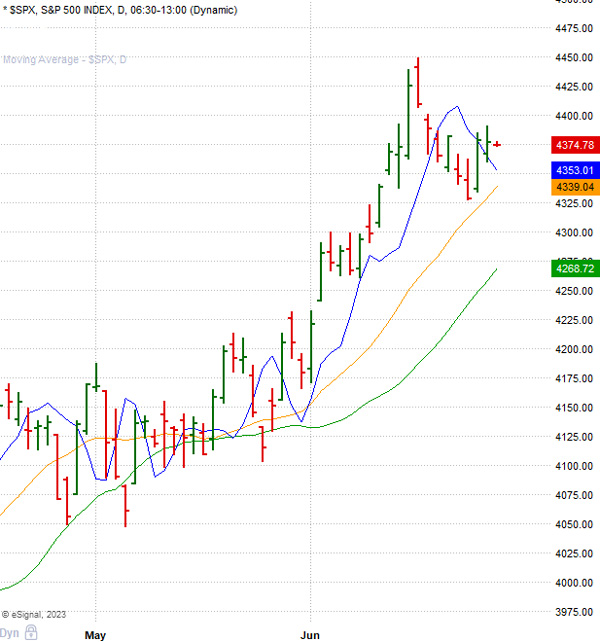
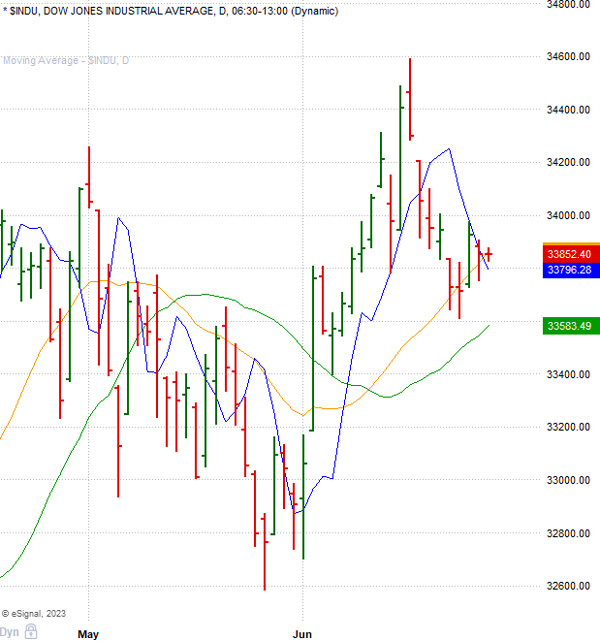
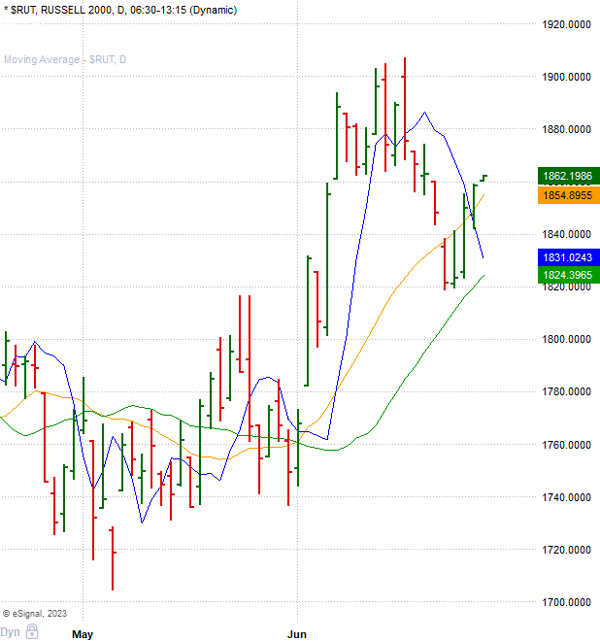
We'll see, but truth be told, it's far more about the technical landscape of the major indexes right now than anything else. Provided here are daily charts of all four: the NASDAQ 100, S&P 500, DOW, and Russell 2000 Small Cap Index. As you can see, all four retraced some of their recent losses yesterday, but that was to be expected.
I sound like a broken record, but it's still all about whether or not the NASDAQ 100 and S&P 500 are going to test their recent highs or if they're going to close back below their 3X3 DMAs (dark blue curved lines) over the next two trading days. If it's the latter, these markets should start moving lower. If it's the former, we're likely going to end up at our previously published targets of $372 on QQQ and $452 on SPY. Again, those levels represent some very important long-term retracement levels on their weekly and monthly charts.


I will also say, the longer this sideways type of grinding activity continues to take place, the more and more it's going to suggest higher levels. In other words, major tops and bottoms are usually preceded by big quick swings in both directions, so any type of extended range-bound activity would be more bullish than bearish. Remember the old William O'Neil tea cup and handle chart pattern? There you go.
That's pretty much it right now. That's what we'll continue to remain fixated on until these markets prove something far more technically definitive than what we've seen for several days now. Small caps have been behaving much better lately, but we've seen that many times over the last year and a half, only for the sector to end up making new lows.
I bring that up because when small caps start to behave for longer extended periods of time than what we've seen to date, that's often an early prelude to a much stronger bull market. While that hasn't happened yet, we continue to eye a number of somewhat risky but attractive small caps that may end up offering very good returns in the years ahead.
As for the rest of these markets, housing stocks have continued to do surprisingly well despite interest rates remaining fairly elevated. That and technology, in general, have continued to be among the stronger sectors so far this year, so we'll see if that changes on a short-term basis sometime soon.
In the meantime, we continue to assemble a fairly short list of bullish ideas we could potentially take advantage of once we've got more clarity on what these markets really want to do in the weeks ahead. Patience is more often than not a good strategy, so we'll simply continue to keep our eyes and ears on everything that's going on and look to bring you more winning ideas when it's all said and done.
Swing Trade Set-Ups w/ Suggested Trade Parameters
Create a Free Trial Here To See Our Current Open Short-Term Trading Ideas: https://www.vikingcrest.com/register
Attractive Long Term Sector/Index ETFs and Individual Companies
Create a Free Trial Here To See Which ETFs We Suggest Investors Maintain Long-Term Exposure To: https://www.vikingcrest.com/register
Important Strategy Tips On Trading, Investing, Portfolio Management and Using Our Service
Very important for any trader and investor who wants to be successful. To review a list of rules and disciplines to consider go here: https://www.vikingcrest.com/article/88. It's a good idea to review this article from time-to-time for any newly added rules.
To view our current trading ideas log-in here: https://www.vikingcrest.com/member. If you have any questions regarding a specific stock - even if it's something we haven't suggested - you can reply directly to this email, or call us at 619-369-9316.
John Monroe - Senior Editor and Analyst
