Trump's Tweets and Defense Stocks - The Dollar, Oil and Gold Updated
Published on April 11, 2018 @ 1:37pm
First it was interest rates, then it was inflation, then it was trade tariffs, then it was data breaches and privacy concerns, and now it's Trump warning Russia to get ready for U.S. strikes on Syria. Yet still, we don't think any of those reasons are going to have a long-term impact on the equity markets.
We've covered all of these issues extensively - with exception to today's headlines regarding Syria. However, even today's headlines shouldn't come as all that much of a surprise. More importantly, we simply need to get used to all of the current administration's transparency.
As a matter of opinion, if the latter really actually does start to escalate, investors and traders may want to have a hard look at four defense stocks we believe continue to have the most potential within the defense space on a go-forward basis.
Lockheed Martin (LMT), Northrop Grumman (NOC), Raytheon (RTN) and Boeing (BA) all have solid fundamentals, solid financials, and all appear to be either at the lower end of their recent trading ranges, or right around the middle of those ranges. And, should military activity start to heat up, there's a very good possibility all four of these stocks could end up finding new highs when it's all said and done.
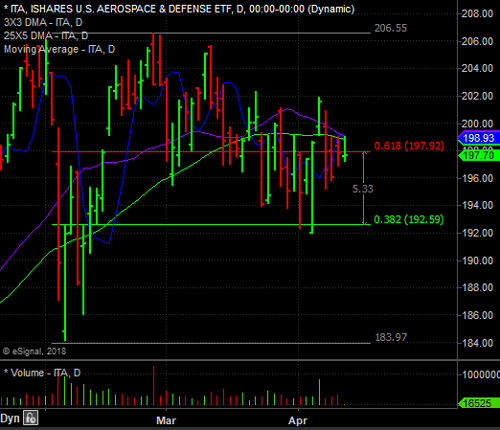
ITA is among the primary ETF's tracking the aerospace and defense sectors. ITA seeks to track the investment results of the Dow Jones U.S. Select Aerospace & Defense Index composed of U.S. equities in the aerospace and defense sector.
Provided here is a daily chart of ITA, which if things do start to escalate between the U.S. and Russia, could start to find some strength soon. As you can see, it recently bounced sharply off a key short-term retracement level around the $192 and change level.
Even from purely a technical perspective right now, it does appears ITA could be in a position to move higher if market sentiment starts to shift over towards defense stocks. It hasn't happened yet, so the markets are pretty much considering today's headlines as a non-event for the time being.

So why the move lower across the major averages this morning? This is what they've been doing for days - no matter what the media headlines are - bull and bears basically trading blows back and forth, while working to develop a constructive bottom.
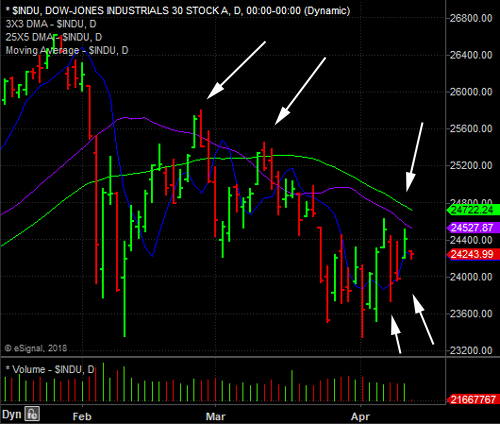
Since we provided you with a daily chart of the NASDAQ Composite yesterday, today we've provided a daily chart of the DOW. As you can see here, we've pointed to a number of key pivot points we believe to be meaningful on a go-forward basis. First, the two bottom arrows in the lower right corner are showing you the DOW would have every right to find its way down there, and the short-term developing bottom would still be intact.
We've also pointed to the last two times the DOW managed to briefly find its way above its 3X3 DMA (blue line), as well as its 50-day simple moving average (green line). On both occasions the index failed, so we'll need to see a strong move back above those two key moving averages, and more importantly some follow through.
If we can get that as we enter the earnings season later this week, or into next week, the markets could be in a position to build on the strength, because it's important to understand first quarter earnings projections for the S&P 500 are still very attractive - despite all of the recent geo-political and macro-economic rhetoric.
The bottom line is we're still very convinced the markets will end up making new highs, it's just a matter of when.

Although the dollar has moved modestly lower in recent days, our previous confirmed bullish reversal signal on the U.S. Dollar Index's weekly chart is still intact. Although anything is possible, we still think the dollar is in a position to start moving higher soon. However, we have to remember our bullish reversal signal was on a weekly chart. Meaning, it could still take a few weeks for the dollar to start moving higher - assuming of course the reversal signal isn't negated over the next few weeks.
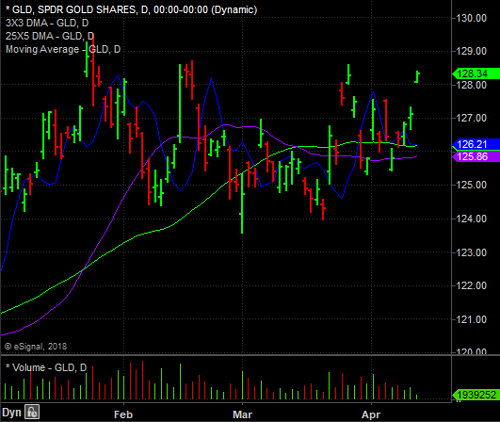
With that, oil and gold both have been experiencing some strength in recent days - with both having moved back up toward the upper end of their range. Provided below are daily charts of the price of light crude and GLD, the primary ETF tracking the price of gold.
We were absolutely right in our call for oil to break down on a short-term basis a few weeks ago, which we've pointed to here. However, we were wrong about where it would end up before finding strength again. As you can see, the price of light crude moved as low as $61 and change, however, it has moved sharply higher over the last few days.


The bottom line with respect to commodities right now is we're staying away until we see building short-term strength in the dollar. It could start happening soon, which would mean commodities might end up range bound in the days and weeks ahead. However, we're not simply going to suggest any sort of commodity short simply on the possibility of a range bound market for commodities in general just yet.
