Financial Sector Concerns - Oil Update and Near-Term Target for Gold
Published on July 17, 2018 @ 11:33am
The markets stalled a bit on Friday following another new all-time high for the NASDAQ Composite, as the S&P 500 and the DOW continue to hover around potentially pivotal levels. Meaning, the S&P 500 and the DOW have found themselves back up around levels that will need to be convincingly breached to the upside if these markets are going to continue to grind higher.
Financials were among the biggest laggards Friday despite some great numbers from JP Morgan Chase (JPM). However, Wells Fargo (WFC) missed on profits, while Citigroup (C) missed on revenue. Those three companies unofficially kicked off the second-quarter earnings season on Friday.
This morning, Bank of America (BAC) and BlackRock (BLK) reported profit and revenue that beat estimates, and tomorrow Goldman Sachs (GS) is scheduled to report its quarterly results, which are actually expected to be pretty good as well. Yet, financials have really yet to pick it up from a trading perspective, which will also need to happen if the broader markets are going to make new all-time highs again - not just the NASDAQ.
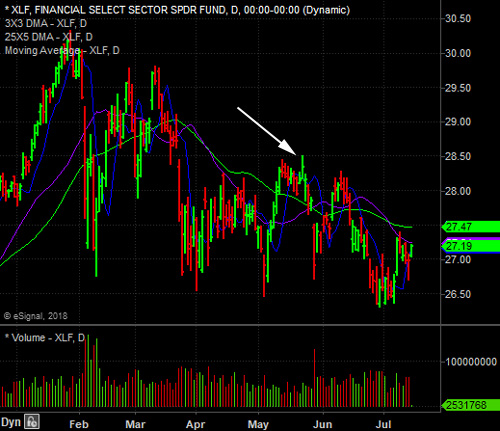
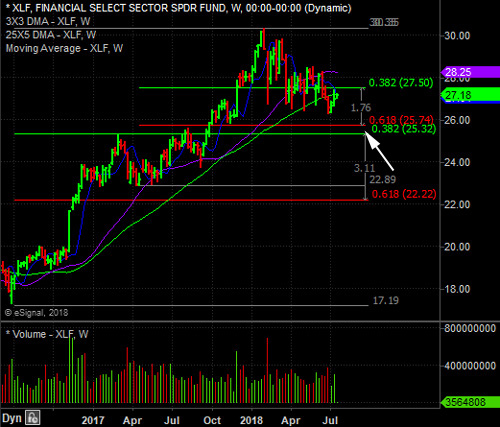
At this point, it's probably not a good idea to simply assume the financial sector is going to start trading better until it actually does. Provided here is a daily and a long-term weekly chart of XLF, the primary ETF tracking the financial sector. As you can see, both the short and long-term charts continue to lag the broader markets pretty badly.
We could actually make a technical argument for a trade to either side on a short-term basis - with the $28 and change level we've pointed to here on the daily chart being a near-term target, while the $25 and change on the weekly chart would make sense to the downside if the S&P 500 and the DOW can't find their footing soon.


It is a bit of a concern that bank earnings have been pretty good, but the stocks associated with all of them can't seem to find any traction - especially with XLF continuing to trend lower on a short and long-term basis.
However, the S&P 500 is expected to grow about 20% for the second quarter when the earnings season comes to an end, so it's literally a bit of a mixed bag right now when we compare current fundamentals with the current technical landscape for equities in general.
In other words, while the NASDAQ Composite, the Russell 2000, and the S&P 500 all continue to suggest potential new highs ahead, the entire financial sector is going to need to pick things up from a trading perspective, or it's likely to give the bears a little hope in the days and weeks ahead.
That's the quandary right now, so we're going to keep a very close eye on the financial sector over the next several days in an effort to determine just how much underlying strength there is for stocks as a whole.
As for commodities, oil is having another rough day. Provided below is a daily chart of the price of crude, and as you can see, it's fast approaching a key short-term retracement level around the $68 level, which also represents the 25X5 DMA (purple line) - a displaced moving average that's often a tough nut to crack to the downside without at least a sharp rally back to the upside first.
The bottom line is we'll stick with our recent bullish oil trade via UCO until either oil breaks below $67.50 per barrel, or until it finds its way back to up to our previously published target of $76 per barrel. We'll see.

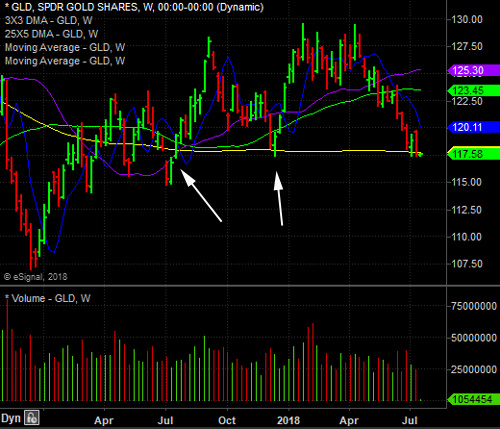
Gold has broken down again in recent days, which you can see on this weekly chart of GLD here, the primary ETF tracking gold. We mentioned last week precious metals do appear to be approaching a level, whereby we'll be willing to step in and put on a contrarian trade on at least a short-term basis. Meaning, a bullish entry into UGLD any day now.
Specifically, we're eyeing anywhere between roughly $116 to $115 to the downside on GLD before we'll suggest a bullish entry into UGLD. It could get there any day now, so we'll keep a close eye, and let you know as soon as we're ready to put on the potential trade.

