Market Volatility Points to Bottom Soon - Cutting Gold - Oil Waffles
Published on December 10, 2018 @ 11:05am
FREE ARTICLE - TRY THE REAL THING FREE FOR TWO WEEKS - NO CREDIT CARD REQUIRED: https://www.vikingcrest.com/register
Volatility continued to close out last week with another sharp reversal back to the downside on Friday following what had initially appeared to be a potential bottom on Thursday. Although we did see some slight early strength to kick off a new week of trading, it remains to be seen just which way these markets will want to heading into today's close.
Honestly, Friday's selloff was actually the first time we've been surprised since these markets started moving lower back in late September. Not only has everything been fairly predictable since then, all of the short-term swings have offered short-term traders quite a bit of opportunity - assuming of course you're not hanging on to anything for all that long.
The bottom line at this point is we're still convinced these markets are close to putting in a bottom. The question is will they put in a bottom around current levels, or are they going to make one more big move lower before potentially snapping back sharply and confirming some semblance of a technical reversal we can actually count on.
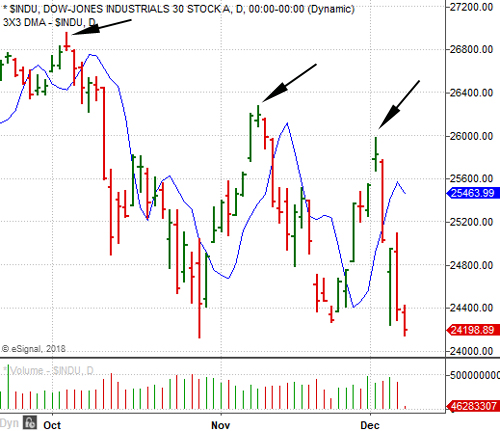
Provided here is a daily chart of the DOW dating back to the beginning of its selloff in early October. Although both the S&P 500 and the NASDAQ Composite have yet to achieve their November lows, you can see here the DOW is attempting to test its November lows right now - literally.
Whether or not that's going to hold is up in the air, but the more concerning issue from strictly a trend and momentum perspective is the small series of lower highs since the selloff began a little over two months ago. That's still the technical issue short sellers are going to hang their hat on until proven otherwise.
Basically, we either need these markets to snap back sharply as soon as today without first moving all that much lower, or we need that one big move down followed by an even bigger move back to the upside. If we can get either of those two technical events at some point today or tomorrow, the major indices will still be in a position to rally into year's end.

We mentioned on Friday oil was on the verge of finally confirming a trend reversal, but we needed a close on the price of crude above $52.38 to close out the week. Although we did get that Friday, the 3X3 DMA (blue line) you see in the price of crude here has moved. This is perfectly normal, as that's what displaced moving averages do - they move. However, it has moved slightly higher today, which means unless we get a significant close above that DMA no later than today or tomorrow, the reversal confirmation will have been negated.

Although the dollar has yet again found some short-term strength, precious metals have continued to be the bright spot on a short-term basis. However, we are finally going to go ahead and cut our previously suggested gold trade via UGLD, post the profits and move on.
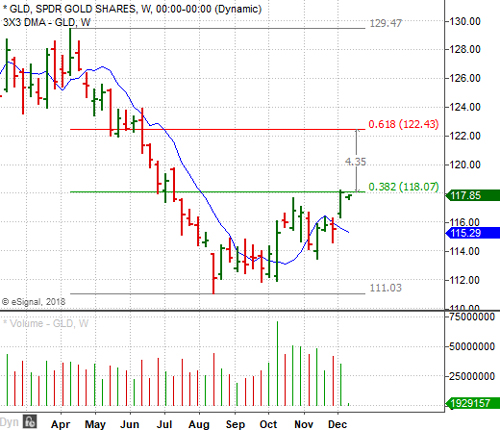
Provided here is a daily chart of GLD, the primary ETF tracking the price of gold. As you can see, GLD has finally achieved a long-term 3/8th's retracement level - all while the major indices continue to hover around a potentially tradable bottom.

The bottom line with respect to precious metals is although we do like precious metals quite a bit on an extremely long-term basis, we do think we may be able to get a better price on gold in the weeks and/or months ahead - assuming of course GLD pulls back now that it has achieved the key retracement level you see here.
Just lightening the load, remaining nimble and looking for the better trading opportunities in the process. Considering how long the UGLD trade was open, it just hasn't moved all that much when you consider how badly the major indices have been behaving. Meaning, one would think gold would have made a much bigger move by now, and it simply hasn't. That's not encouraging for gold, at least on a short-term basis anyway.
John Monroe - Senior Editor and Analyst
