Equity Markets Continue to Grind Higher - Commodities and the Dollar Updated
Published on March 18, 2019 @ 7:50am
A new week, a new options period and an ongoing technical landscape of mixed signals coming from all of the major indices on a near-term basis. Meaning, while the S&P 500 and the NASDAQ continue to lead these markets higher, the DOW, the Russell 2000 and emerging markets still aren't suggesting they're ready to make new highs for the year again - not yet anyway. That could change as soon as this week, but it's probably not a good idea to simply assume the broader markets are going all that much higher until they actually do.
All of the major averages have gotten a little long in the tooth once again - without any sort of significant pullback along the way. Therefore, a decent enough selloff should be on the horizon. It's not a matter of if, simply a matter of when.
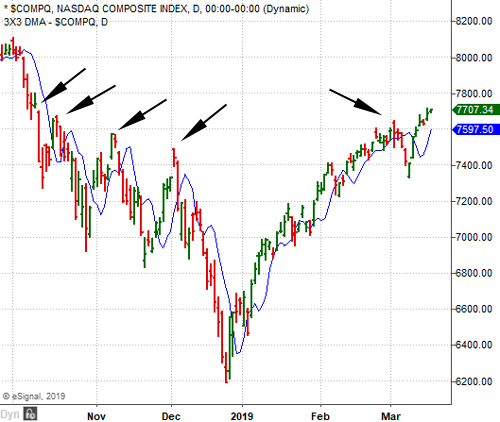
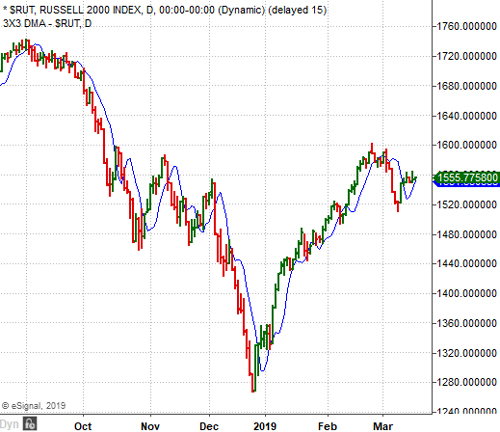
We continue to talk about the discrepancies between all of the above mentioned indices, so once again we've provided daily charts of both the NASDAQ Composite and the Russell 2000 below. As you can see, while the tech and biotech heavy NASDAQ continues to lead these markets higher, the often leading Russell 2000 decided to be the first of the major indices to take a breather a few weeks ago - all while the NASDAQ and the S&P 500 continue to move higher.
So which index is right? Obviously both for now, however, now that the NASDAQ has finally managed to breach all three highs from the fourth quarter of last year, it does make technical sense the index may now be on the verge of pulling back for a bit.
You can also see we've pointed to a small gap back on October 9th of last year, which the NASDAQ just filled on Friday. That gap took place just four trading days after the markets staged one of their biggest market-wide selloffs in years. In other words, the NASDAQ has found itself ever so close to last October's high again - all without staging any significant pullback along the way.

When we drill down into the Russell 2000, the primary index tracking small cap stocks confirmed a sell signal two weeks ago today and has yet to find its way back to that all-important high. As a matter of fact, every time it has tried to find some strength over the last few trading days it has been hit with modest selling, which is why we continue to stick with our index short of the Russell 2000 via TZA, the primary bearish leveraged ETF tracking the Russell 2000 Small Cap Index.
Again though, our ongoing hedge against the small cap sector right now is simply just that - a hedge against the possibility of a market-wide breakdown in the days and/or weeks ahead. However, TZA does continue to flirt with our previously suggested entry of $9.45 per share, so we'll have to continue to keep a close eye on it over the next day or two.

We've still got several open ideas on our list ranging from quality large caps to a handful of quality small cap names we still find attractive on a longer-term basis. Therefore, we'll continue to maintain exposure to these names until proven otherwise.
The bottom line is we're still very long-term bullish, but we do think there's enough technical context on a short-term basis to suggest the possibility of at least another market-wide pullback anywhere between where these markets are right now and about 2,880 on the S&P 500.
That's only 58 points from where the S&P 500 closed on Friday, so a little patience and more of a watch and see approach is probably prudent right now for those short-term traders looking to take advantage of the markets' next big move. The risk between here and there continues to increase as these markets move modestly higher. Rather than simply chase these markets higher, we recently decided to take some profits off the table in certain names, and look for potentially more attractive entry levels in the days and/or weeks ahead.
As for the long-term buy and hold investor, there's still no definitive technical or fundamental reasons to lighten up on equities until a point in time we believe they've completely exhausted themselves to the upside. As a matter of strong opinion, we're very convinced the S&P 500 can find its way to just above the 3,000 level before we'll be looking to reassess what might happen next on an extremely long-term basis.
Much of that will be predicated on how it gets to the 3,000 level. Meaning, if it goes there in a straight line, that could become a concern, but as long as everything remains orderly along the way, these markets still have every technical and fundamental right to move higher.
Commodities continue to creep higher - with oil still working its way toward our previously published target of $62 - $63 per barrel. Provided here is a daily chart of the price of WTI Crude showing you its recent trading activity. As you can see, all it's going to take is continued modest strength in oil before that target should be achieved.
Our target is strictly technical, because now that a fairly key 3/8ths retracement level has been breached to the upside, and considering the ongoing strength being displayed across the equities markets in general, we're pretty convinced oil should continue higher until a point in time the above mentioned target level is achieved.

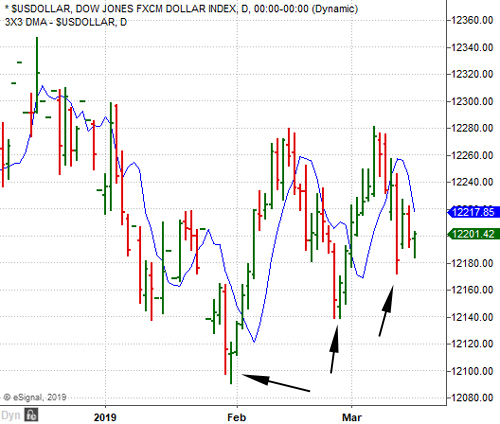
Further, you can see on this daily chart of the US Dollar Index below the dollar continues to waffle back and forth despite our ongoing bearish call for the dollar to continue lower on a near-term basis. However, if either of the first two recent lows we've pointed to here our breached to the downside, we're likely going to see precious metals and energy continue higher.

There's no question there will always be an increasing demand for commodities in general, so it's more about when commodities are going to start outperforming that of the broader markets. However, as long as rates remain low and the dollar holds up, commodities are in no real position to move substantially higher - not yet anyway.
We do continue to believe exposure to commodities in general on a go-forward basis should end up being a savvy move when it's all said and done, but until the dollar starts to show much stronger signs of breaking down, commodities will likely continue to waffle between key technical levels over the last few years.
To view Current Open Picks log-in here: https://www.vikingcrest.com/member. If you have any questions regarding a specific stock - even if it's something we haven't suggested - you can reply directly to this email, or call us at 619-369-9316.
